Semantic-Structural Alignment for Generative Pictorial Charts
SIGGRAPH 2026 (TOG)
Zhida Sun, Yulin Zhang, Zheng Gu, Min Lu, Bongshin Lee, Daniel Cohen-Or, Hui Huang*
Shenzhen University, Yonsei University



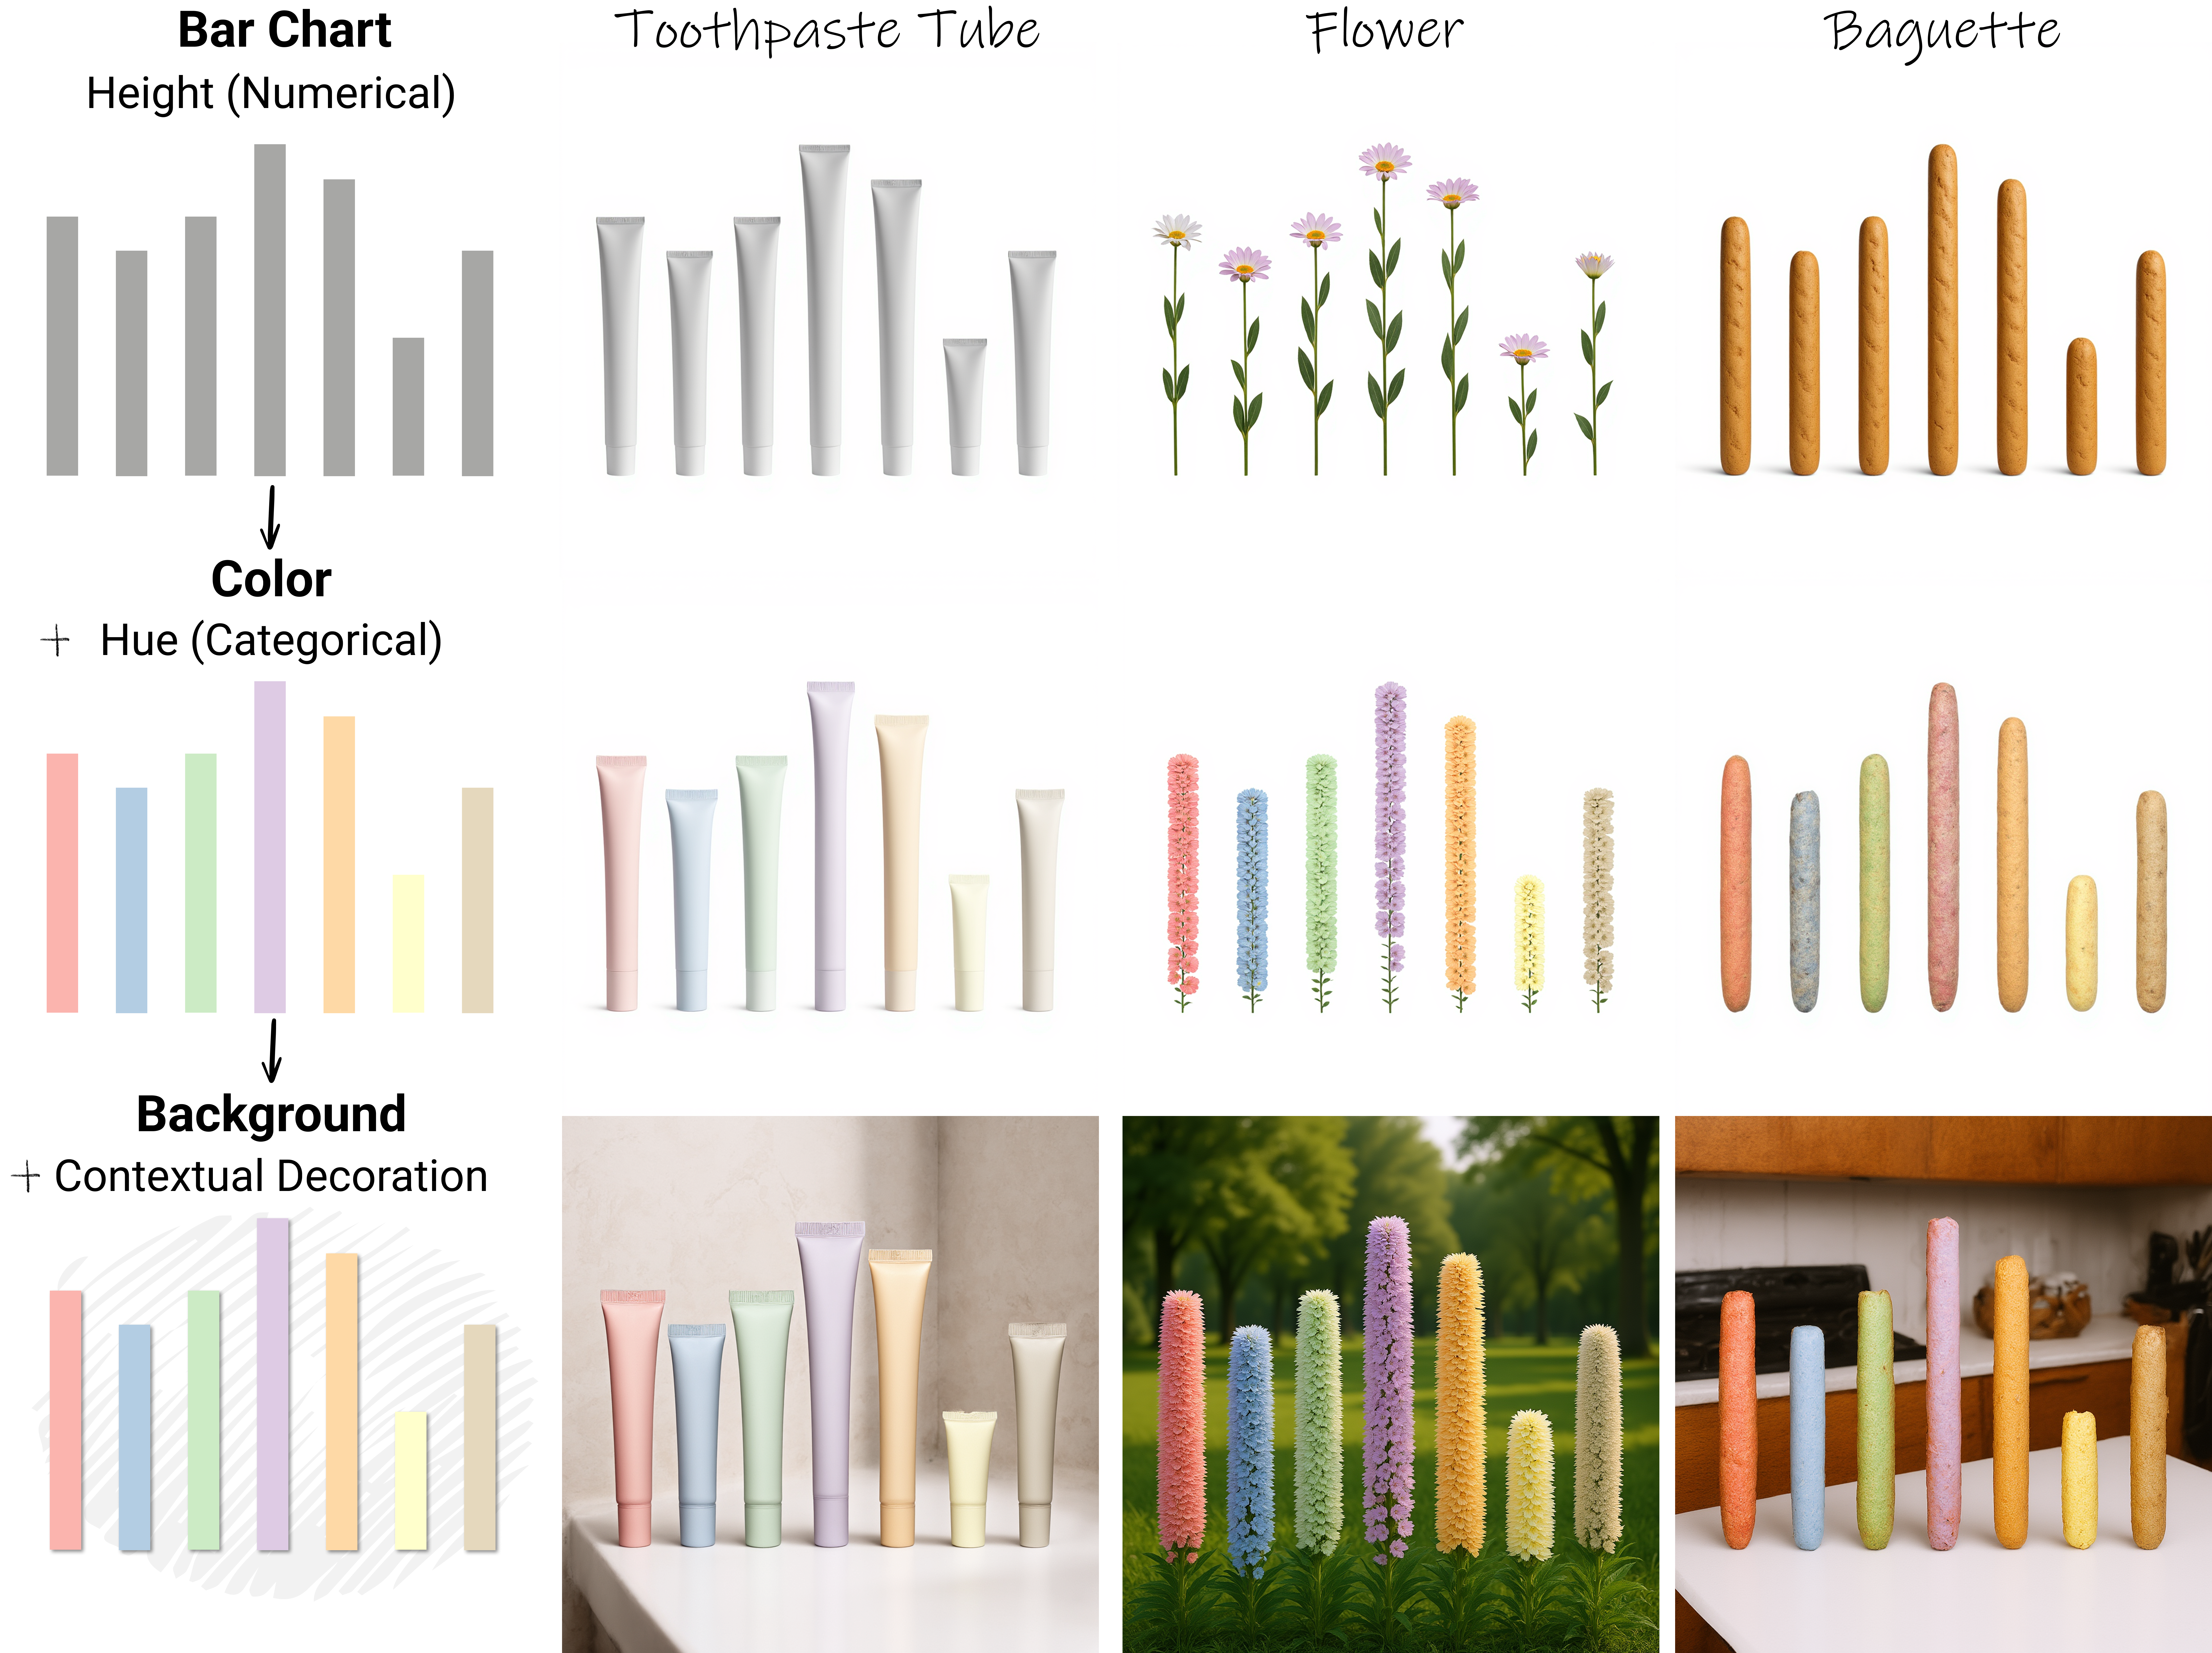
Overview
SSAlign is a generative framework for the automated synthesis of pictorial charts that bridges the gap between semantic expression and structural faithfulness. Rather than treating charts merely as images to be stylized, we frame the problem as a dual-conditioned generation task guided by two parallel external control signals: a text prompt capturing the semantic context of the editing intent, and a context image providing the abstract statistical chart’s global structure. To reinforce these controls within a Multi-Modal Diffusion Transformer, we introduce two complementary feature-level mechanisms: structural alignment to anchor spatial layouts to the input chart, and semantic alignment to transfer expressive textures from reference images. Generalizing across major visual channels (i.e., length, area, angle, and position) and diverse semantic domains, our method produces pictorial charts that are both artistically compelling and structurally consistent.
Installation
The recommended setup is to recreate the exported conda environment:
conda env create -f environment.yml
conda activate ssalign
Model Weights
FLUX.1 Kontext can be loaded directly from Hugging Face by model id, so a local download is optional. By default, run.py uses:
black-forest-labs/FLUX.1-Kontext-dev
If you have already downloaded the base model locally, you can still pass the local path:
--model-path /path/to/FLUX.1-Kontext-dev
The SSAlign LoRA checkpoint download:
Then either set environment variables:
export FLUX_KONTEXT_MODEL=black-forest-labs/FLUX.1-Kontext-dev
export FLUX_TRANSFER_LORA=checkpoints/ssalign.safetensors
or pass the paths explicitly:
--model-path black-forest-labs/FLUX.1-Kontext-dev
--lora-path checkpoints/ssalign.safetensors
Quick Start
The main user inputs are the chart type and the semantic object:
--chart-type: one ofbar,pie,bubble, orline--object: the object used to replace chart elements
run.py automatically builds both the generation prompt and the reference reconstruction prompt from these two values. Advanced users can override them with --prompt and --reference-prompt; custom prompts should follow the templates in Prompt Templates.
Without Reference Image
This mode uses only the chart image and prompt. It does not invert a reference image.
python run.py \
  --model-path /path/to/FLUX.1-Kontext-dev \
  --lora-path /path/to/ssalign.safetensors \
  --input-image input/pie.png \
  --chart-type pie \
  --object watermelon \
  --output-dir output \
  --seed 42
With Reference Image
This mode first inverts the reference image, then uses the inverted latent trajectory for appearance transfer.
python run.py \
  --model-path /path/to/FLUX.1-Kontext-dev \
  --lora-path /path/to/ssalign.safetensors \
  --input-image input/pie.png \
  --reference-image input/watermelon.png \
  --chart-type pie \
  --object watermelon \
  --output-dir output \
  --seed 42
Outputs are saved as:
output/{chart}_{object}/no_reference/transfer_seed_<seed>_00.png
output/{chart}_{object}/with_reference/transfer_seed_<seed>_00.png
output/{chart}_{object}/{mode}/prompt.txt
For example, with --input-image input/pie.png and --object watermelon, the output folders are:
output/pie_watermelon/no_reference
output/pie_watermelon/with_reference
CLI Arguments
Core inputs:
--input-image: source chart image.--chart-type: input chart type. Must be one ofbar,pie,bubble, orline.--object: semantic object used to transform chart elements and name the output folder.--reference-image: optional appearance reference image.--prompt: optional custom target pictorial-chart prompt. If omitted, it is generated from--chart-typeand--object.--reference-prompt: optional custom prompt used when reconstructing the reference during inversion. If omitted, it is generated from--object.--output-dir: output root directory. Results are automatically saved under{output_dir}/{chart}_{object}/with_referenceor{output_dir}/{chart}_{object}/no_reference.
Model and runtime:
--model-path: FLUX.1 Kontext checkpoint path or Hugging Face model id.--lora-path: optional LoRA checkpoint. Defaults toFLUX_TRANSFER_LORAwhen set.--device: default iscudawhen available.--dtype:bf16,fp16, orfp32.--height,--width: generation resolution, default1024.--steps: denoising steps, default50.--guidance-scale: target image guidance scale, default5.0.--reference-guidance-scale: reference reconstruction guidance scale, default2.5.--seed,--num-images: deterministic sampling controls.
Alignment controls:
--appearance-align: enables reference-based appearance alignment. In the currentrun.py, this flag defaults to enabled.--kv-alpha-max: maximum reference appearance interpolation strength.--kv-start-ratio,--kv-end-ratio: denoising interval for semantic KV interpolation.--kv-schedule:step,linear, orcosine.--structure-align: enables query-based structure alignment. In the currentrun.py, this flag defaults to enabled.--q-beta,--q-start,--q-end: strength and denoising range for structure alignment.
Prompt Templates
By default, run.py generates prompts from --chart-type and --object.
Reference prompt:
A realistic image of a {object}, front-facing view, isolated on a plain white background, no additional objects.
Chart prompts:
bar:
Transform the bar chart into a semantic image where each bar is replaced by a {object}. Each {object} must exactly match the original bar's height and proportion, preserving all relative heights, order, spacing, position and proportions. Realistic style, no text.

pie:
Transform the pie chart into a semantic image where each slice is replaced by a segment of a {object}. Each segment of the {object} must exactly match the original slice's angle and proportion, preserving all relative angles, order, spacing, position and proportions. Realistic style, no text.

bubble:
Transform the bubble chart into a semantic image where each point is replaced by a {object}. Each {object} must exactly match the original point's position and area, preserving all relative positions, spacing, and proportions. Realistic style, no text.

line:
Transform the line chart into a semantic image where each segment is replaced by a {object}. Each {object} must exactly match the original segment's position, preserving all relative positions, order, spacing, and proportions. Realistic style, no text.
If you override --prompt or --reference-prompt, keep the same structure: name the chart type, name the object, and explicitly state which geometric properties must be preserved.
Notes and Limitations
- Reference-guided appearance transfer depends on the quality and viewpoint of the reference image.
- Strong structure alignment may preserve chart geometry but can also bias the output toward chart-like artifacts.
- The current code is a research prototype and keeps the modified Diffusers source in
src/diffusers.
Citation
@article{10.1145/3811313,
        author = {Sun, Zhida and Zhang, Yulin and Gu, Zheng and Lu, Min and Lee, Bongshin and Cohen-Or, Daniel and Huang, Hui},
        title = {Semantic-Structural Alignment for Generative Pictorial Charts},
        year = {2026},
        issue_date = {July 2026},
        publisher = {Association for Computing Machinery},
        address = {New York, NY, USA},
        volume = {45},
        number = {4},
        issn = {0730-0301},
        url = {https://doi.org/10.1145/3811313},
        doi = {10.1145/3811313},
        abstract = {Traditional statistical graphics are precise but often lack the visual appeal, memorability, and engagement of pictorial charts. We present a generative framework for the automated synthesis of pictorial charts that bridges the gap between semantic expression and structural faithfulness. Rather than treating charts merely as images to be stylized, we frame the problem as a dual-conditioned generation task guided by two parallel external control signals: a text prompt capturing the semantic context of the editing intent, and a context image providing the abstract statistical chart's global structure. To reinforce these controls within a Multi-Modal Diffusion Transformer, we introduce two complementary feature-level mechanisms: structural alignment to anchor spatial layouts to the input chart, and semantic alignment to transfer expressive textures from reference images. Generalizing across major visual channels (i.e., length, area, angle, and position) and diverse semantic domains, our method produces pictorial charts that are both artistically compelling and structurally consistent. Extensive quantitative evaluations and perceptual user studies demonstrate that our framework outperforms traditional controllable generation and image editing baselines, providing a foundation for high-fidelity, data-driven generative modeling in expressive visual storytelling. Project page: https://ssalign.github.io/.},
        journal = {ACM Trans. Graph.},
        month = jul,
        articleno = {140},
        numpages = {11},
        keywords = {pictorial charts, semantic alignment, structural alignment}
        }
Acknowledgements
This code builds on the Diffusers implementation of FLUX.1 Kontext and uses FLUX’s MM-DiT architecture as the generative backbone.
python run.py   --model-path /path/to/FLUX.1-Kontext-dev   --lora-path /path/to/ssalign.safetensors   --input-image input/bar.png   --chart-type bar   --object feather   --output-dir output   --seed 42
python run.py \
  --model-path /mnt/d/huggingface/FLUX.1-Kontext-dev \
  --lora-path /mnt/d/project/code/ssalign.safetensors \
  --input-image input/bar.png \
  --chart-type bar \
  --object feather \
  --output-dir output \
  --seed 42